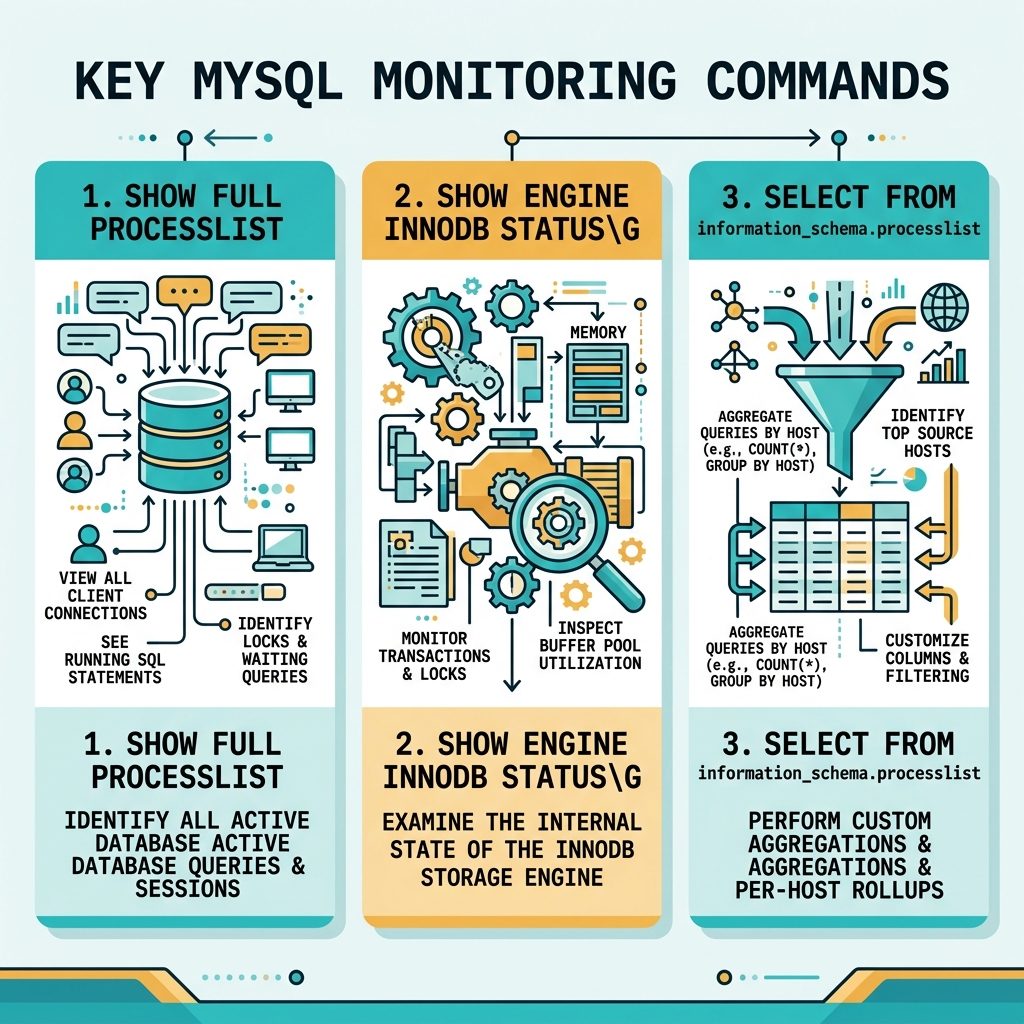
To find what’s pinning MySQL at 100% CPU, start inside the MySQL prompt. SHOW FULL PROCESSLIST lists every active connection with its current query and how long it’s been running; SHOW ENGINE INNODB STATUS\G shows internal InnoDB state (deadlocks, long transactions). For a per-host breakdown, query information_schema.processlist directly.
Last verified: 2026-05-17 on MySQL 8.0 and MariaDB 10.11. Originally published 2022-12-06, rewritten and updated 2026-05-17.
Step 1 — confirm MySQL is the CPU hog at the OS level
# Most active processes, sorted by CPU
top -o %CPU

# Or just the mysql/mariadb threads
top -H -p $(pgrep -d, mysqld)
If mysqld is consistently at the top and using 100%+ CPU (a multi-core box can show >100% per process), the bottleneck really is inside MySQL — drop into the prompt next.
Step 2 — see what’s running
mysql -u root -pSHOW FULL PROCESSLIST;Look at the Time, State, and Info columns. Queries spending many seconds in Sending data, Copying to tmp table, or Sorting result are the usual culprits. Info contains the SQL — copy it and run EXPLAIN on it later to find the missing index.
Step 3 — see InnoDB internals
SHOW ENGINE INNODB STATUS\G;The big text blob is dense, but the sections to scan are:
- LATEST DETECTED DEADLOCK — both transactions involved, the queries, the locks they wanted.
- TRANSACTIONS — long-running transactions (look at
ACTIVEseconds) holding locks or burning resources. - SEMAPHORES — non-zero waits often signal lock contention.
- BUFFER POOL — hit rate; a low rate combined with high CPU usually means a full table scan is shredding the buffer pool.
Step 4 — break it down by host and user
SELECT SUBSTRING_INDEX(host, ':', 1) AS host_short,
       GROUP_CONCAT(DISTINCT user) AS users,
       COUNT(*) AS threads
FROM information_schema.processlist
GROUP BY host_short
ORDER BY COUNT(*), host_short;
This rolls up the processlist by client host — useful on shared VPSes where one of several apps has gone runaway. If app01.example.com shows 60 threads and everything else shows 1–2, that app is the source.
Step 5 — break it down by database
SELECT db,
       COUNT(*) AS threads,
       SUM(time) AS time_total,
       MAX(time) AS time_max
FROM information_schema.processlist
WHERE command != 'Sleep'
GROUP BY db
ORDER BY time_total DESC;
Step 6 — kill the worst offender (stopgap)
KILL 12345; -- where 12345 is the Id from SHOW PROCESSLISTKilling the runaway query buys you headroom to investigate without dropping every connection. After things calm down, the real fix is in the application: add the missing index, rewrite the query, or rate-limit whatever cron is hammering the database.
Frequently asked questions
\G at the end of SHOW ENGINE INNODB STATUS do? \G is a MySQL CLI terminator that prints rows vertically (one column per line) instead of as a wide table. SHOW ENGINE INNODB STATUS returns a single row with a giant text blob, so vertical format is the only readable way to see it. Use \G on any query in the CLI when the output would otherwise be unreadable.
SHOW FULL PROCESSLIST should I look at first? Sort mentally by Time (seconds spent in the current state) and State. Long-running queries with states like Sending data, Copying to tmp table, or Sorting result are the usual CPU eaters. Info shows the SQL. Anything stuck in Waiting for lock isn’t burning CPU — it’s the query holding the lock that is, and you’ll see that elsewhere in the list.
Combine information_schema.processlist with the db column: SELECT db, COUNT(*) AS threads, SUM(time) AS time_total FROM information_schema.processlist WHERE command != 'Sleep' GROUP BY db ORDER BY time_total DESC;. If one application’s database dominates, that’s your target.
KILL the runaway query? Yes — KILL <id>; using the Id from SHOW PROCESSLIST terminates that thread. The query stops, the user’s request returns an error, and any in-flight transaction rolls back (which can itself be slow on a large transaction). Killing is a stopgap; the fix is adding the missing index, rewriting the query, or rate-limiting the calling app.
Related guides
- How to Check Which MySQL Database Is Using the Most CPU
- How to Troubleshoot MariaDB Not Starting
- How to Export and Import All MySQL Databases at Once
References
SHOW PROCESSLIST: dev.mysql.com/doc/refman/8.0/en/show-processlist.html. SHOW ENGINE INNODB STATUS: dev.mysql.com/doc/refman/8.0/en/show-engine.html. information_schema.processlist: dev.mysql.com/doc/refman/8.0/en/information-schema-processlist-table.html.